 As I wrote in my article about balance sheet risk, a company with covenants in its loan agreements may have to hedge balance sheet risk even though it is not optimal from a market risk perspective.
But how can the company know which covenant to hedge? Often a company will have more than one covenant, and hedging one of them may adversely impact the other. To answer the question it is necessary to calculate the effect of a hedge strategy, and the best way to do that is by using a simulation model. Such a model can give the answer by estimating the probability of breech of a covenant.
Which hedging strategy the company is to choose demands knowledge about what covenant is the most at risk. How likely is it that the company will face a breech? Like I described in the previous article:
Which hedging strategy the company chooses depends on which covenant is most at risk. There are inherent conflicts between the different hedging strategies, and therefore it is necessary to make a thorough assessment before implementing any such hedging strategy.
In addition:
If the company hedges gearing, the size of the equity will be more at risk [..], And in addition, drawing a larger proportion of debt in the home (or functional) currency may imply an increase in economic risk. [..] Hence, if the company does not have to hedge gearing it should hedge its equity.
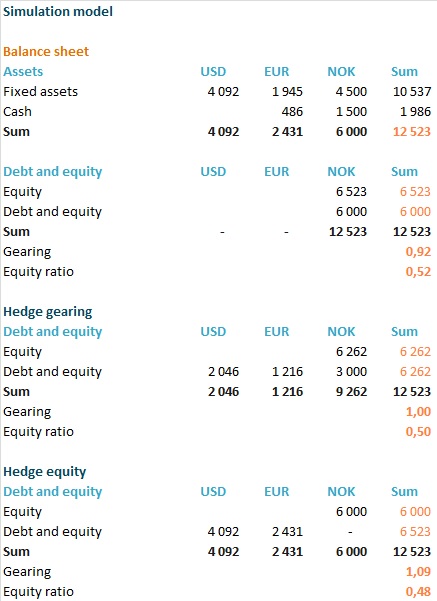
To analyse the impact of different strategies and to answer the questions above I have included simulation of currency rates in the example from the previous article:
The result of strategy choice given a +/- 10% change in currency rates was shown in the previous article. But that model cannot give the answer to how likely it is that the company will face a breech situation. How large changes in currency rates can the company take?
To look at this issue I have used the following modeling of currency rates:
- Rates at the last day of every quarter from 31/12/02 to 30/06/2013. The reason for choosing these dates is of course that they are the dates when the balance sheet is measured. It doesn’t matter if the currency rates are unproblematic March 1st if they are problematic March 31st. Because that is the date when books are closed for Q1 and the date when the balance sheet is measured.
- I have analysed the rated using Excel @Risk, which can fit a probability curve on historical rates. There are, of course, many methods for estimating currency rates and I will get back to that later. But this method has advantages; the basis is actual rates which have actually occurred.
The closest fit to the data was a LapLace-curve ((RiskLaplace (μ,σ) specifies a laplace distribution with the entered μ location and σ scale parameters. The laplace distribution is sometimes called a “double exponential distribution” because it resembles two exponential distributions placed back to back, positioned with the entered location parameter.)) for EUR and a Uniform-curve ((RiskUniform(minimum,maximum) specifies a uniform probability distribution with the entered minimum and maximum values. Every value across the range of the uniform distribution has an equal likelihood of occurrence)) for USD against NOK.
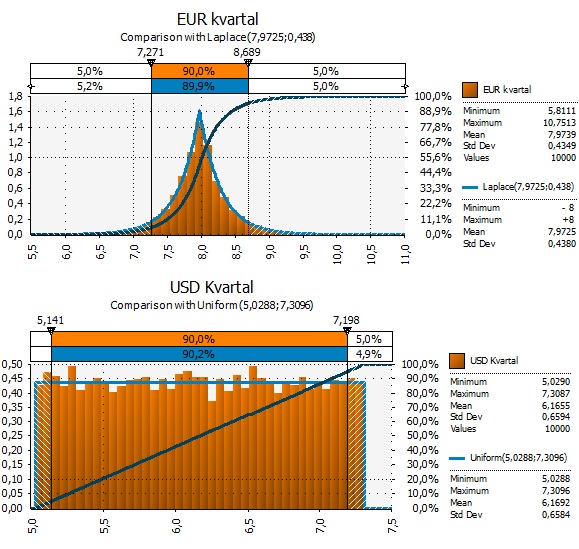
It is always a good idea to ask yourself if the fitted result has a good story behind it. Is it logical? What we want is to find a good estimate for future currency rates. If the logic is hard to see, we should go back and analyze more. But there seems to be a good logic/story behind these estimates in my opinion:
- EUR against NOK is so called mean reverting, meaning that it normally will revert back to a level of around 8 NOK +/- for 1 EUR. Hence, the curve is pointed and has long tails. We most likely will have to pay 8 NOK for 1 EUR, but it can move quite a bit away from the expected mean, both up and down.
- USD is more unpredictable against NOK and a uniform curve, with any level of USD/NOK being as likely, sound like a good estimate.
In addition to the probability curves for USD and EUR an estimate for the correlation between them is needed. I used the same historical data to calculate historical correlation. On the end quarter rates it has been 0,39. A positive correlation means that the rates move the same way – if one goes up, so does the other. The reason is that it was the NOK that moved against both currencies. That’s also a good assessment, I believe. History has shown it to be the case.
Now we have all the information needed to simulate how much at risk our (simple) balance sheet is to adverse currency movements. And based on the simulation, the answer is: Quite a bit.
I have modeled the following covenants:
- Gearing < 1,5
- Equity > 3 000
This is the result of the simulation (click on the image to zoom):
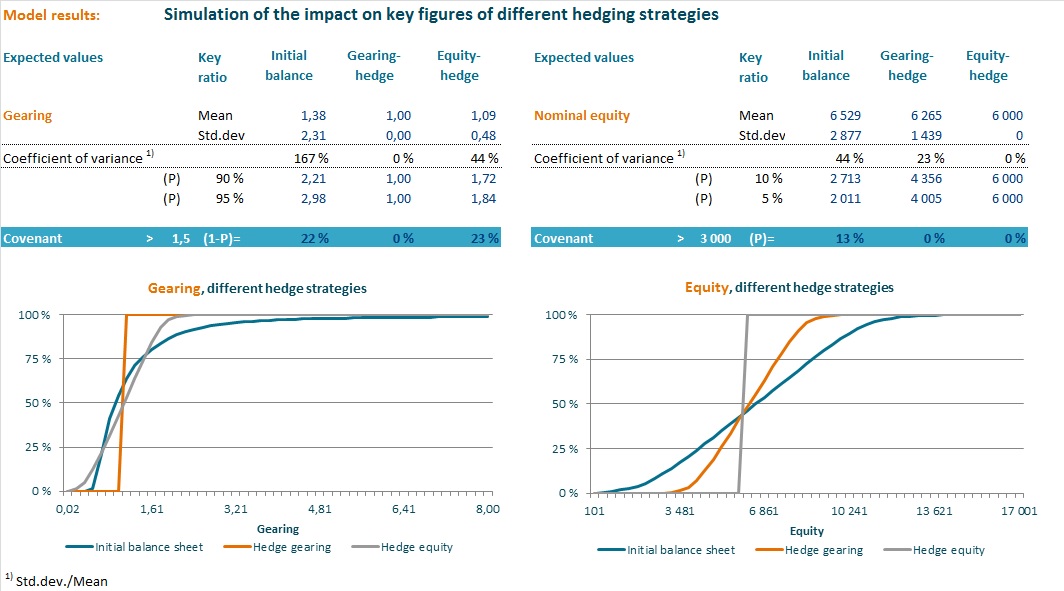
Gearing is the covenant most at risk, as the tables/graphs show. Both in the original mix (all debt in NOK) and if the company is hedging equity there is a high likelihood of breaching the gearing covenant.
There is a probability of 22% in the first case (all debt in NOK) and a probability of 23% in the second (equity-hedge). This is a rather high probability, considering that the NOK may move quite a bit, quit quickly.
The equity is less at risk and the covenant has more headroom. There is a 13% probability for breech with all debt in NOK, but 0% should the company choose either of the two hedging strategies. This is due to the fact that currency loans will reduce risk, regardless of whether debt fully hedges assets, or only partially.
Hence, based on this example it is easy to give advice to the company. The company should hedge gearing by drawing debt in a mix of currencies reflecting its assets. Reality is of course more complex than this example, but the mechanism will be the same. And the need for accurate decision criteria – likelihood of breech – is more important the more complex the business is.
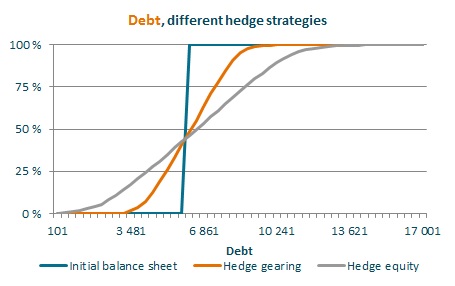 One thing that complicates the picture is the impact different strategies have on the company’s debt. Debt levels may vary substantially, depending on choice of strategy.
If the company has to refinance some of its debt, and at the same time there is a negative impact on the value of the debt (weaker home currency), the refinancing need will be substantially higher than what would have been the case with local debt. This is also answers you can get from the simulation modeling.
The answer to the questions: “How likely is it that the company to breech its covenants and what are the consequences of strategic choices on key figures, debt and equity?” is something really only a good simulation model can give.
