
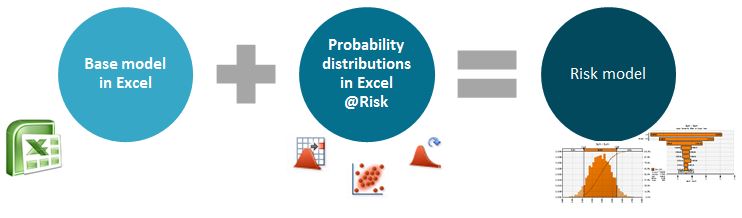
Excel @Risk is an Add-in to Excel made by Palisade Corporation. With an Excel-model as basis, @Risk can simulate and calculate figures which will assess the risk in the base calculations.
So, the starting point for risk modelling with Excel is a model which captures the relationships between variables you want to model. In most models there are assumptions which are used to calculate values or results. These assumptions are more or less uncertain, and this uncertainty can be estimated as probability distributions.
Excel @Risk can also be added to existing models, where the necessary addition to create a risk model is to identify the uncertain variables and assign probability distributions.
Excel @Risk is based on recognized statistical methodology and calculates risk by assigning a probability distribution to each assumption variable. By assigning a distribution, not just analysing a down side scenario, these kinds of models also gives estimates for the upside in the case being analysed.
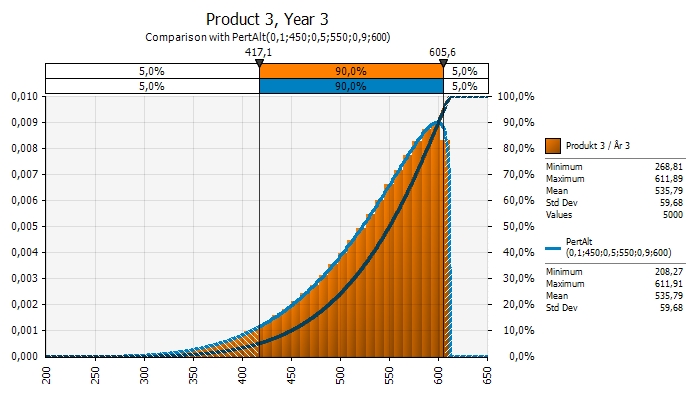 The modelling of uncertainty is done by defining probability distributions based on the variability which can be expected in the different assumptions. In addition the correlations between variables van be modelled. Correlation is important as it will impact risk and should be modelled to get a good risk estimate for the goal function.
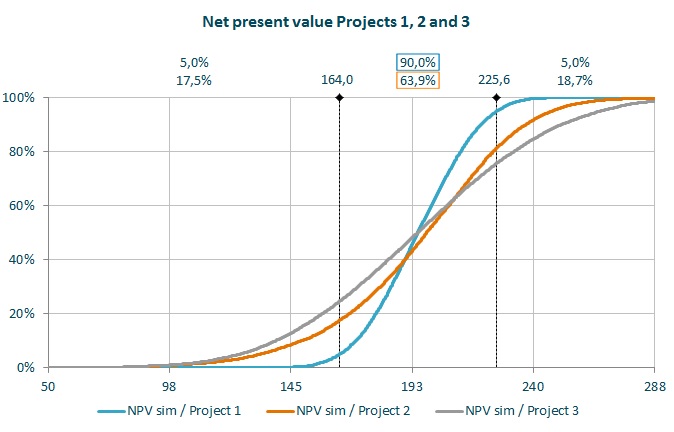 The result of the simulation can be presented as distributions or as a VaR-number, an impact tornado or values on given probability levels. Excel @Risk will calculate key statistical figures, such as the standard deviation, the probability for a certain value or the value for a certain probability. This puts numbers on the risk inherent in for instance different projects, making it possible to compare them. @Risk can also do advanced sensitivity analysis and what-if scenarios.
 For result variables in the goal function the tool can compare probability curves and analyse sensitivity, both by stress-testing and by impact tornado charts. Tornado charts show which variables have the biggest impact on value. This makes it easier to prioritize risk mitigation measures.
The advantage of Excel @Risk compared to other software which can do Monte Carlo Simulation is that the underlying Excel model is transparent user and thus easier to control for the user. Excel is the main tool used by organizations to model various issues, and the user will just be adding on functionality to his or hers preferred tool. Since Excel @Risk can be incorporated into existing models it means that the user does not have to start at scratch to build a risk model.
As in all Excel modelling it is crucial to ensure that the underlying model is robust, but with a robust base model Excel @Risk will be all you need to assess business risk in a quantitative way.
