
 The strategic decisions of a business are based on plans and assumptions about how the future will develop. These assumptions are more or less uncertain, in fact, the only thing that is certain that the outcome will not be exactly as expected. A plan and the financial estimates it contains is a modelled representation of the future. It is a simplification of future reality based on limited assumptions.
Reality is always more complex than a model representation will show, no matter how large and complex a model. And in retrospect, when it turns out that reality was not as simplified as it was modelled, organizations spend a lot of time and huge effort to explain why results were not as expected. Big and strategic decisions with big impact on future earnings are made based on simple assumptions about the future.
Decisions are made without calculating the probability of the expected result. This means that projects that have roughly the same expected return may have very different potential for loss and gain – without this being taken into account when making the decision. Often only qualitative assessments of risk are made, and such qualitative assessments can be very subjective.
Obviously assessments of the risk in assumptions are also made by individuals with subjective perceptions. Nevertheless, the risk will be measurable and analysable to a much higher degree if the probability distributions for different assumptions are set, and they are run together in a simulation model and quantified. The correlation between variables may also be taken into account, which will enhance the analysis further.
Taking the «right» decisions under uncertainty with unknown probabilities is difficult, if not impossible. If risk is modelled with quantitative methodology it will increase the predictability of the value creation an investment project can be expected to create. The company’s risk-carrying ability will be in focus – how much risk can be taken to increase potential earnings?
The following example illustrates this:
Projects 1, 2 and 3 have the same net present value, the same investment cost and the same expected cash flow over 10 years. By the looks of it, the company can randomly choose between the projects and expect the same result. A review of the risk profile of each project in a simulation model, however, will give a different picture.
| Values | Min | 5 % | 10 % | 25 % | 50 % | 75 % | 90 % | 95 % | Max | Std.dev. |
|---|---|---|---|---|---|---|---|---|---|---|
| Project 1 | 139 | 164 | 170 | 181 | 195 | 208 | 219 | 226 | 248 | 19 |
| Project 2 | 45 | 133 | 149 | 175 | 198 | 220 | 237 | 247 | 319 | 35 |
| Project 3 | 62 | 125 | 139 | 165 | 195 | 225 | 251 | 266 | 355 | 43 |
- Project 1 has the lowest standard deviation, lowest potential loss but also the least potential gains
- Project 2 has the greatest potential loss, but also less potential gain than Project 3
- Project 3 has the highest risk measured by standard deviation, the greatest potential gain while at the same time lower maximum potential loss than Project 2
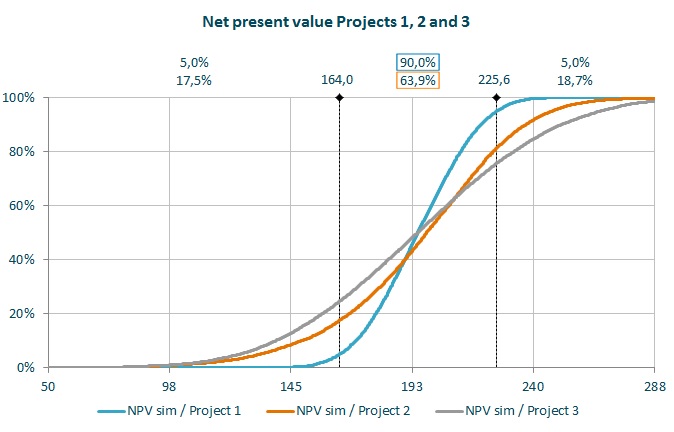 As the graph shows, the projects have very different risk profiles. Project 1 has a low risk, but also the lowest potential profit. Project 3 has the highest risk measured by standard deviation, but higher potential profit than Project 2. Which project is right for the business depends on its risk bearing capacity and risk appetite.
There are other important factors which are not apparent in this simple example, such as the degree to which the projects correlate with the existing business. A project that has a high risk on a standalone basis may have attributes that reduce total risk when it is combined with other projects or the existing business. If the project contributes to balancing the risk inherent in the rest of the business, a seemingly risky project may be refusing risk as part of the business as whole.
This type of modelling also gives the business the opportunity to put risk mitigation measures in place at an early stage, since how much risk is involved in the projects is calculated and the business is aware of it. If this probability is unknown, risk control is less in focus than if estimates are in place. The business will know a lot more about how likely it is that a decision will lead to success or failure.
