
 In a model which aims to estimate risk there are two main indicators which are used to describe the uncertainty in the variables:
- Volatility: How much can variable values be expected to differ from their expected values?
- Correlation: How do different variables impact each other?
In this article I will cover modelling of correlation.
If two variables are correlated it means that they follow a distinct pattern when their values change. They correlate in a specific way.
Correlation is in statistics and probability calculation is a measure of the strength and direction of the linear dependency between two variables. Empirically observed correlation is a necessary, but not sufficient assumption to uncover causality (i.e. if one variable is the cause of the development in another)
Correlation is measured by a coefficient from +1 (positive correlation) to -1 (negative correlation
 Positive correlation
Between two variables mean that they move in the same direction
 Negative correlation
Between two variables mean that they move in opposite directions
 Neutral correlation (coefficient = 0)
Means that the variables are independent of each other
Correlation will contribute to increased or reduced risk.
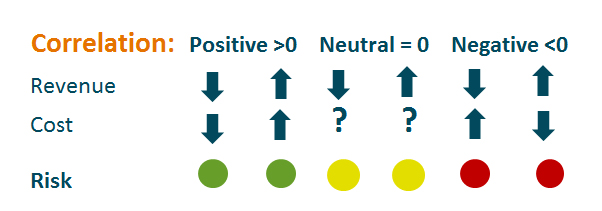 Generally a positive correlation between revenue items and cost items will reduce risk. If the price of a product falls and the cost of producing it also falls (the product and cost are positively correlated) it means that the risk level is lower than otherwise. If the correlation is negative cost will increase if product prices fall. The risk is therefore higher.
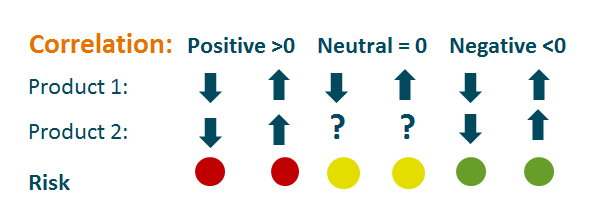 If two products have a positive correlation the risk impact is different; if two products or two cost items correlate it means that if the revenue from one product falls, so does the revenue from the other product.
As this shows it is vitally important to model correlation to get a good picture of overall risk in the cash flow and P&L of a company. Correlation can also be modelled as regressions, but I will focus on how it can be modelled as coefficients for use in for instance Excel @Risk models.
The impact can be quite significant, as seen in the chart below showing the risk level with and without correlation:
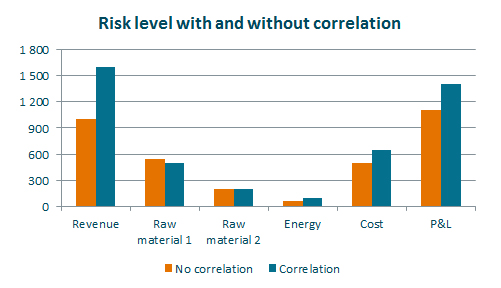 As the chart shows, the risk level is higher after introducing correlation into the model. The reason is positive correlation between the products the company is selling. To some extent this is dampened by positive correlation between revenue and cost. Hence, the P&L risk is lower than the sum of risk for revenue and cost in isolation.
Correlation coefficients can be modelled in different ways
- As a calculated historical correlation
- Stylistic for key variables, or
- As neutral (no correlation)
Or as a combination of these depending on what best describe the relationship between variables.
Some questions are important to ask when using historical data to describe the future:
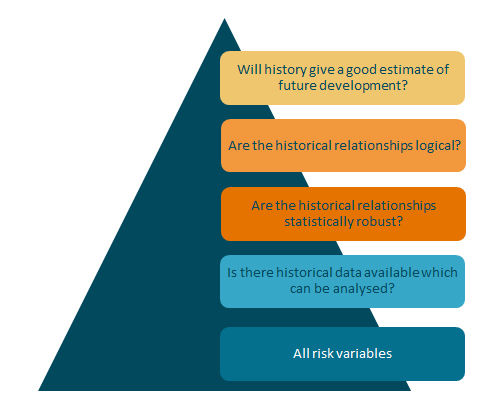
As the figure shows, historical correlations should not always be used. Often the available data is not good enough, the calculated relationships are not necessarily statistically robust and they may not even sound logical. In addition history may not describe future development well. – changes may occur which makes what worked yesterday not work today.
There are some pitfalls worth mentioning when modelling correlations:
- Correlation is misinterpreted as cause, when it’s not. A correlation does not alone prove causality. A correlation may be a historical coincidence explaining little or nothing in the future.
Example: If there is a high positive historical correlation between power prices in Norway and beer-prices in Australia, can you then say that if Norwegian power prices increase, so will beer-prices in Australia?
- A historical pattern may break in the future. What explained the past will not explain the future. Reality changes.
Example: Paradigm change – changes in conditions leading to development taking a different direction – like changing currency regime from fixed to floating.
- If you model too many relationships it will be difficult to identify what really creates risk. Focus on the main variables, risk modelling the future is not about decimal precision. No model will describe reality 100%.
Example: 20 variables are to be correlated with each other, resulting in a 20*20 correlation matrix which needs to be consistent ((If A is correlated to B and A is correlated to C, then B is correlated to C as well)). The task is almost impossible unless you can use a dump of historical correlation ((For instance by using Palisade StatTools)) or limit yourself to “stylising” the relationships with round figures.
My overall recommendation for modelling correlations is:
- Analyse historical data if you have them, but do not base the entire model on history. It is always an advantage to know what history has shown, but it does not have to describe the future well. An exception is financial instruments where there are liquid market prices – for instance currency rates.
- Model only the key variables. What variables drive the value creation in the company? These are the ones you should focus on estimating.
- Model the correlation between key variables in round figures, for instance
-0,9 ((Correlation is rarely 1))
-0,5
0
0,5
0,9
- Revise the modelled correlations periodically. They will not remain the same for eternity. And events may occur which demands a revision of the correlation matrix.
Finally, here is an example which sheds light on why it is so important to model the relationship between variables. Let us assume that the Purchasing Manager wants to hedge the price of one of the raw materials the company is using. Hedging it will reduce the risk the PM is responsible for. Let’s assume he hedges 50% of the cost for Raw material 1. What will the impact on the company’s risk level be?
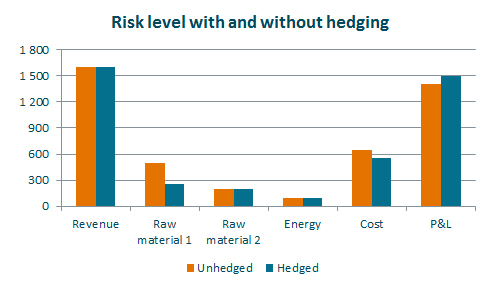 As the Purchasing manager expected, the risk is reducedboth for Raw material 1 and for total cost. But the overall risk is increased. This is due to the positive correlation between revenue and cost. So, if the volatility in raw materials is removed or reduced, without the same being done for products creating revenue, the result is increased variability overall.
What looked like a nice, risk reducing measure was the opposite. It increased the company’s risk. This underlines the importance of modeling the relationships between variables. Without doing that, it is not possible to have a good view of the actual risk.
